A Heap Dump is a snapshot of the memory of a Java process at a certain point of time. This snapshot contains information about the Java Objects and Classes in the heap.
Step 1: Configure the JVM to generate a Heap Dump on an OutofMemory
In order to generate a heap dump when an "java.lang.OutOfMemoryError: Java heap space" exception occurs, the first thing to do is to add -XX:+HeapDumpOnOutOfMemoryError in the VM parameters. I am using Jboss6 server, so belong are the modifications. If you want to have a heap dmp on "CTRL BREAK", you can also add this parameter -XX:+HeapDumpOnCtrlBreak.


When an OutofMemory happens, this will generate a java_pid*.hprof file in the "C:\jboss-6.1.0.Final\bin" directory. This path can be changed in the VM parameters : -XX:HeapDumpPath= path_of_the_dump_file.


Step 2: Force the generation of a Heap Dump
1- Using JConsole
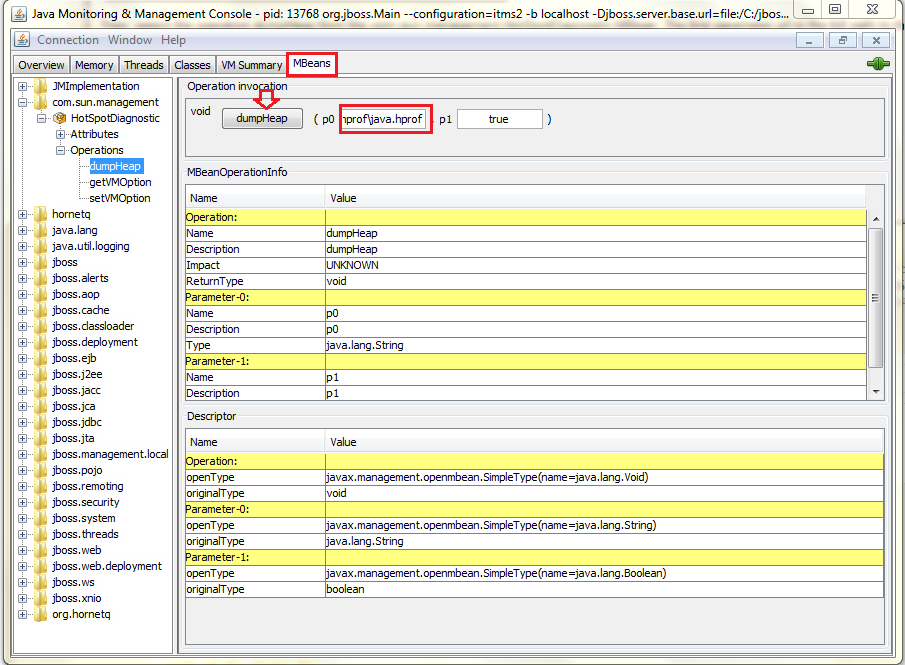
Another way to generate a heap Dump is by using the JCONSOLE which can be found in the "C:\Java\jdk1.6.0_20\bin" directory.
Select the dumpHeap operation from the com.sun.management.HotSpotDiagnostic MBean. As parameter p0 you should specify the full path to the heap dump file (exp "C:\hprof_Directory"). The file name should ends with .hprof. Clic to the dumpHeap button, a file will be generated in the choosen directory.
2- Using Memory Analyzer from Eclipse
Another way to have a Heap Dump is to use the Memory Analizer Plugin which can be added to eclipse. Please refer to this link.
Open the Memory Analysis.
Then acquire a heap dump:
Step 2: Heap Dump Analysis
Once you have created your heap dump, you can analyze it using MAT (Memory Analzer). So Open the heap dump and navigate in the different options.


No comments :
Post a Comment